Wij hoeven het belang en de kracht van Value Stream Mapping (VSM) niet meer te toe te lichten.
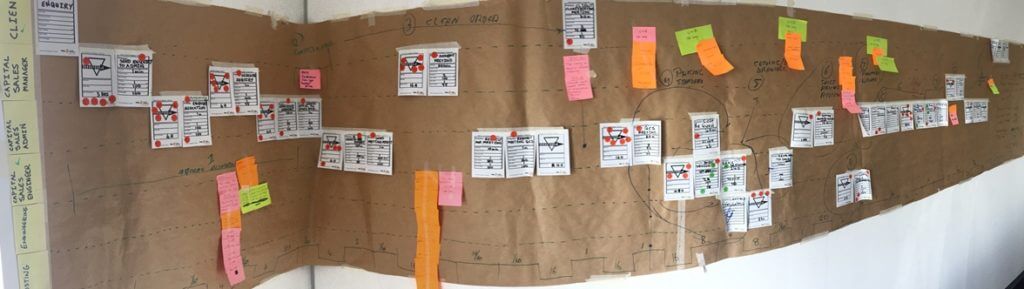
VSM (of ook wel Brown paper genoemd) is het gereedschap waarmee je de organisatie tegen het licht kunt houden en zien waar de verbeter opties zich bevinden. Waar we in de theorie nog vaak uitgaan van de originele VSM opmaak beschreven door Mike Rother en John Shook in het boek “Learning to see”, maakt LMP gebruik van de zogenaamde Business Value Stream Map (B-VSM). Deze uitvoering maakt het gemakkelijker om ook de voorliggende processen te beschrijven waardoor een compleet beeld ontstaat vanaf offerte aanvraag t/m levering inclusief eventuele installatie.
De originele VSM is sterk gericht op productie en assemblage processen. We weten echter uit ervaring dat de oorzaak van verspillingen vaak al voorin in het proces verborgen zitten. Ook zitten de grootste verspillingen vaak niet in een afdeling maar juist tussen twee afdelingen. De kracht van een B-VSM komt hier naar voren.
Onze aanpak:
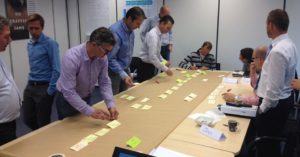
- Selecteer een team van kennisdragers waarbij uit elke afdeling minimaal 1 vertegenwoordiger zit.
- Neem een of twee voorbeeld orders welke representatief zijn
- Teken de Actuele B-VSM op (zoals het dus werkelijk gaat)
- Identificeer gezamenlijk de verspillingen
- Maak de toekomstig gewenste B-VSM
- Prioriteer de verspillingen aan de hand van een Pick chart of Critical-to matrix
- Voer 20% van de verbeter opties uit welke 80% van het resultaat geven.
Het resultaat:
Een door de eigen organisatie opgesteld verbeterplan (bottum up) welke aansluit bij de strategie van het bedrijf waarna de medewerkers zelf aan de slag gaan om de verbeterpunten te gaan realiseren. Hiermee is draagvlak verkregen door de gehele organisatie.